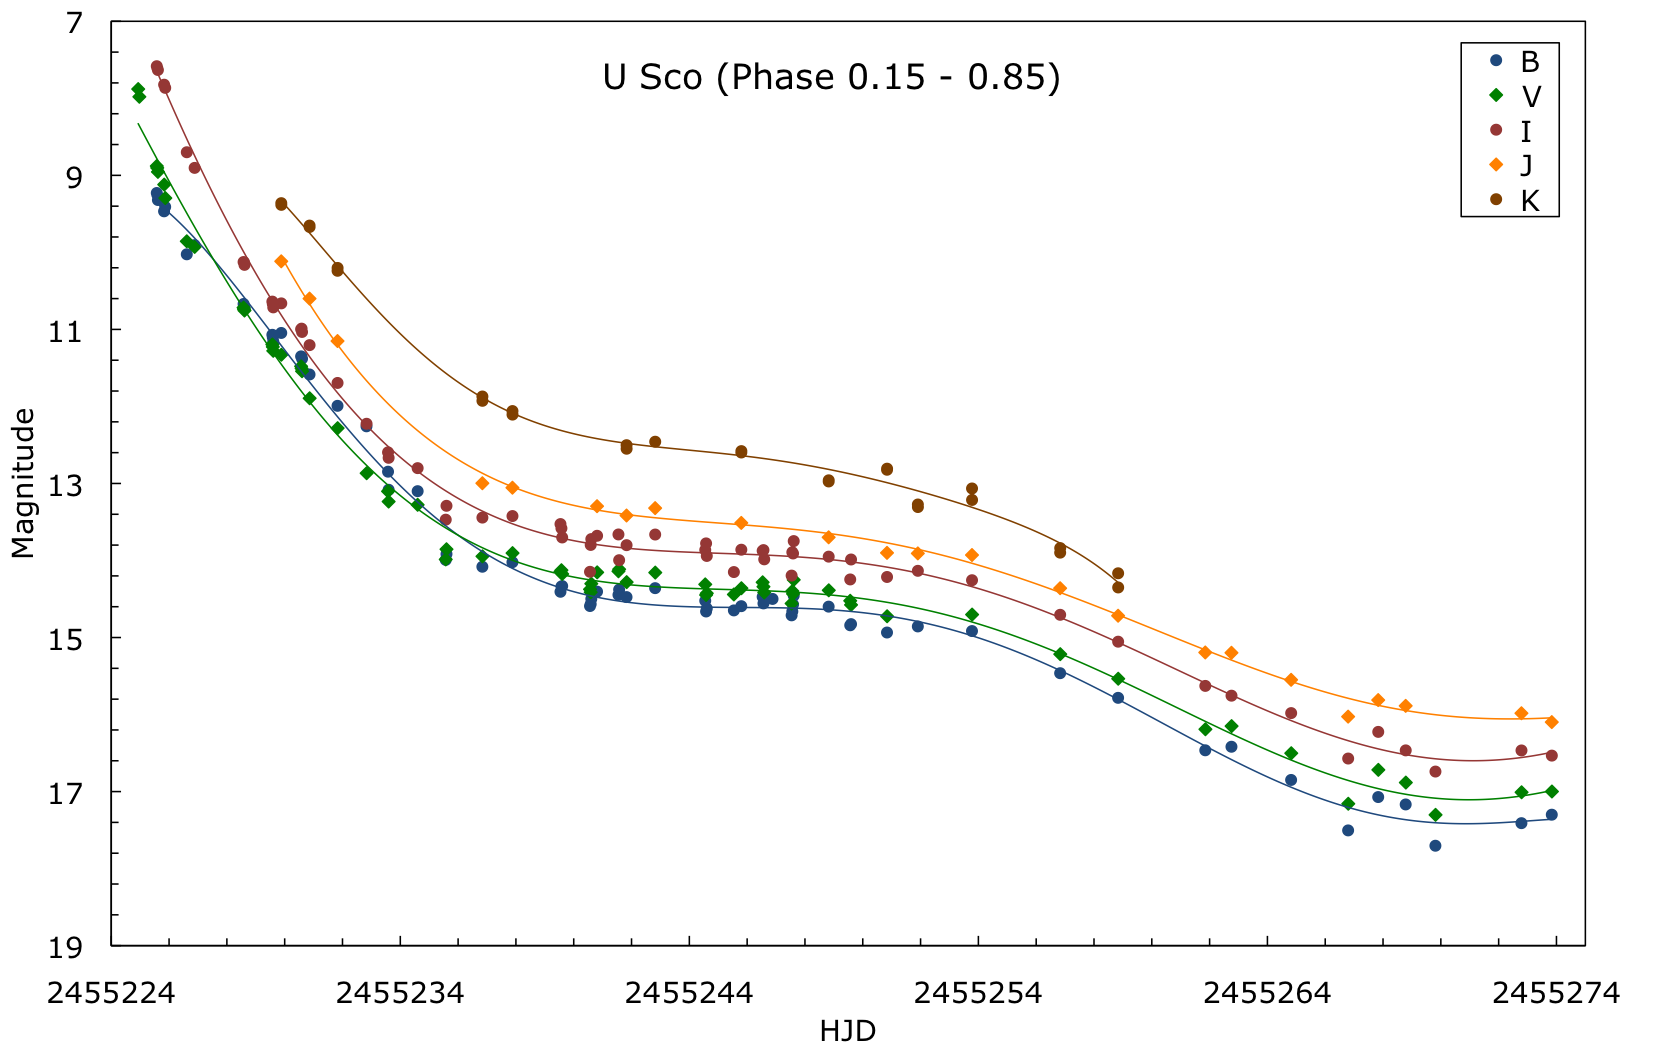
Figure 1: BVIJK light curves of U Sco (outside eclipse, phases 0.15-0.85) from discovery (2010 Jan 28.4385) to 49 days after discovery (2010 Mar 18.28). The smooth curves are a polynomial fit through the plotted points to guide the eye.
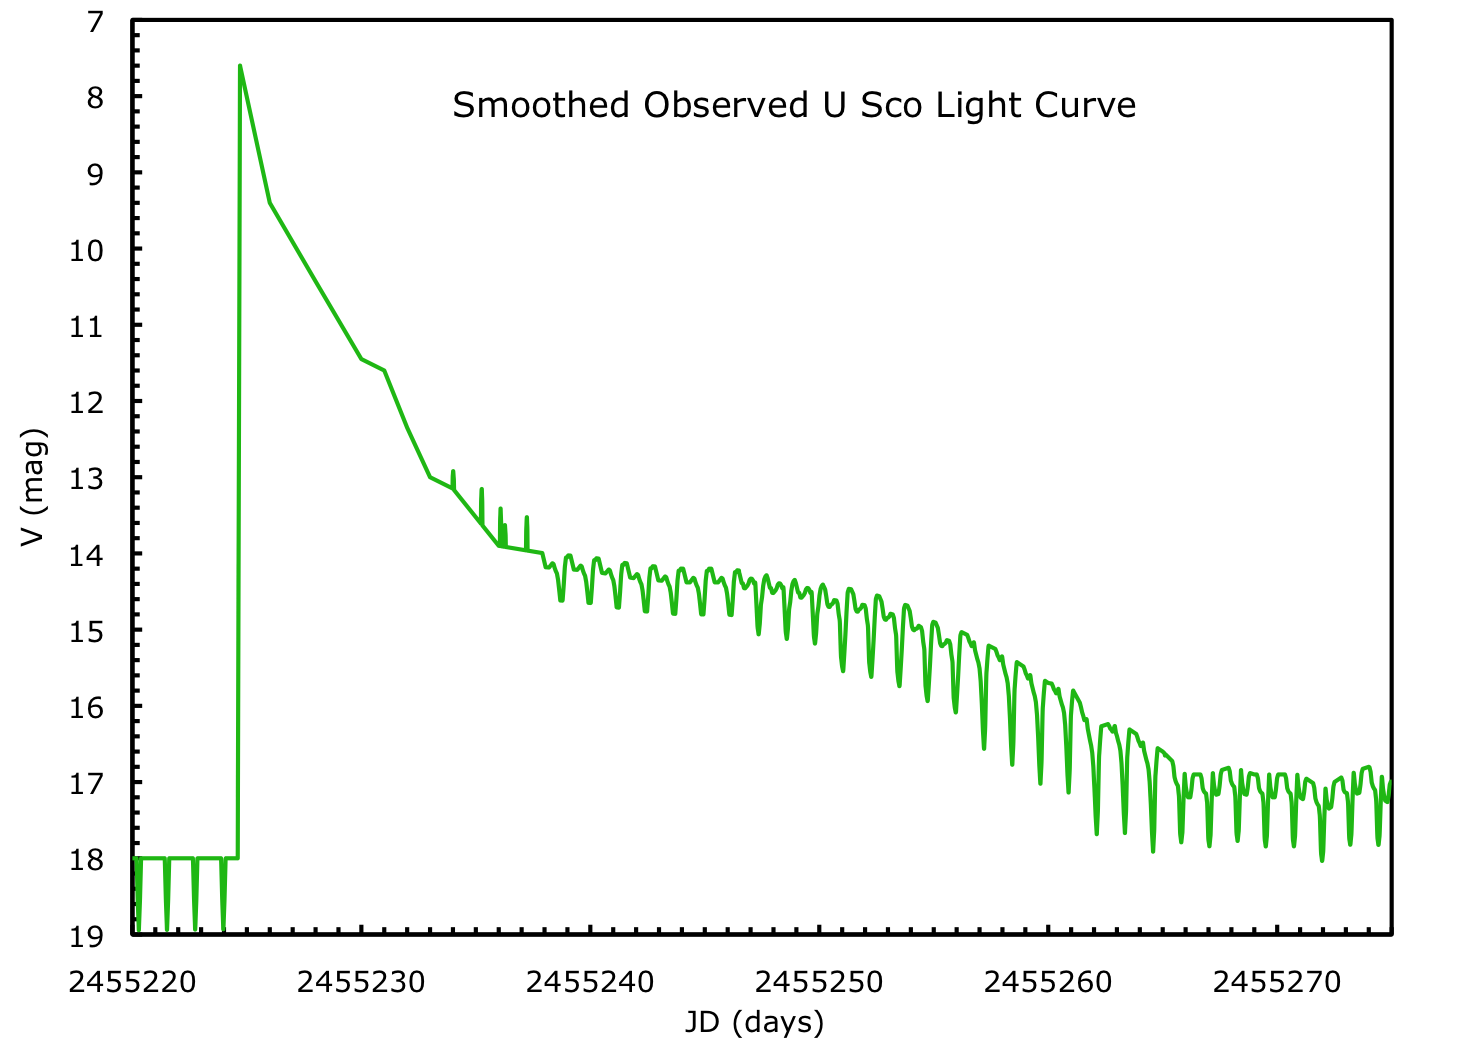
Figure 2: U Sco has been monitored with fast photometry for roughly half the time since its peak, and these time series have been used to construct a realistic light curve with all the gaps filled in based on the similarities between the light curves at the same orbital phases in adjacent orbits. This observed light curve (with smoothing and interpolation for a sampling time of 0.01 day) from JD 2455220.0 to 2455275.0 (Jan 23.5 to March 19.5) is shown. The data used to construct this curve is accessible in .csv form here. We note that the pre-eruption flickering is not known exactly, some flares soon after the peak were undoubtedly missed, the late flickering has been averaged over, and the rise and peak are adopted from sketchy information from prior eruptions. Nevertheless, this V-band light curve reproduces the essential variations of the U Sco eruption. When combined with the slowly-varying colors in the table, the magnitude of U Sco can be estimated for any time and in any optical/IR band throughout the eruption. This should allow spectroscopy to be flux calibrated with a reasonable accuracy.
The full text of this ATel is available here.
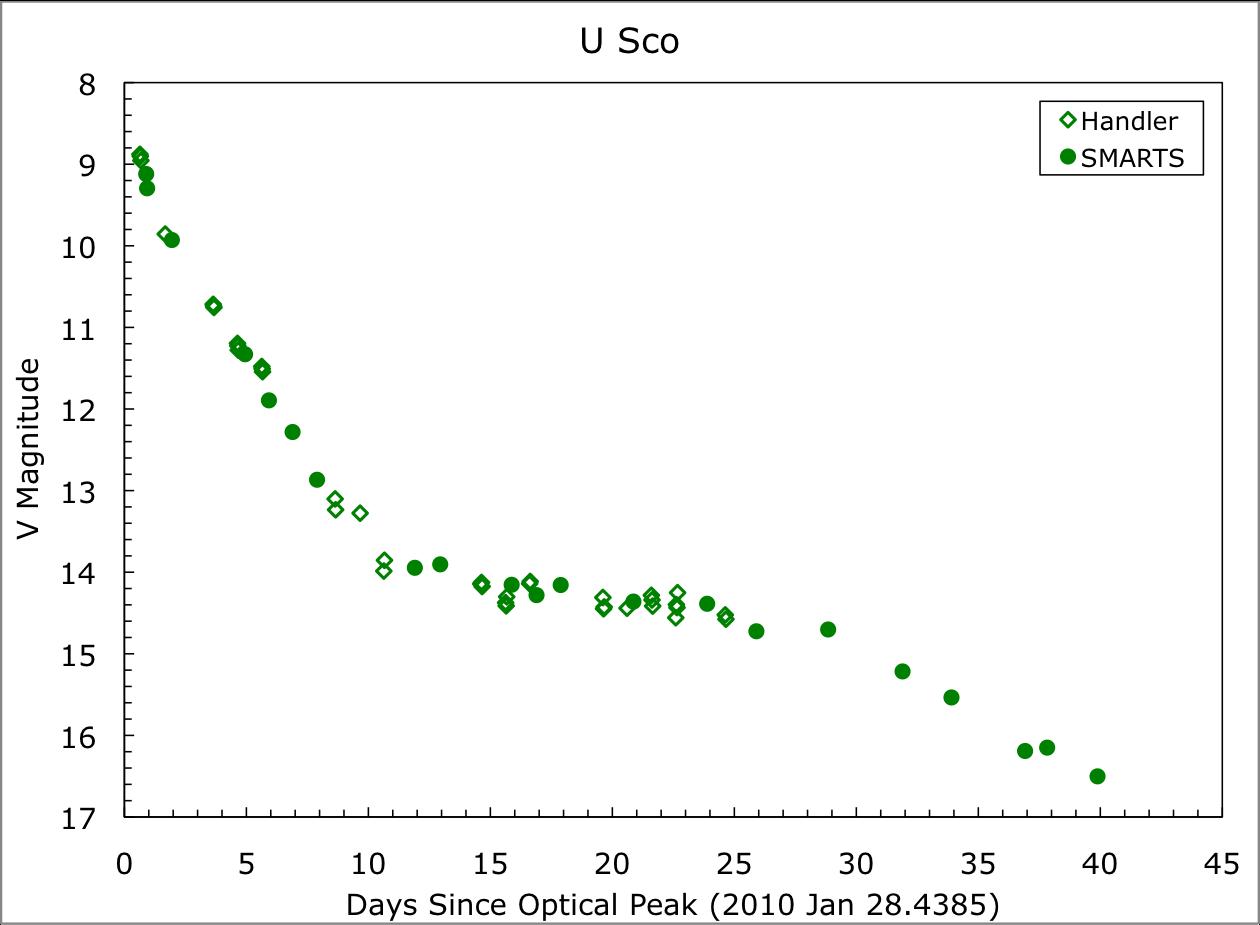
Figure 1: V-band light curve of U Sco (outside eclipse)
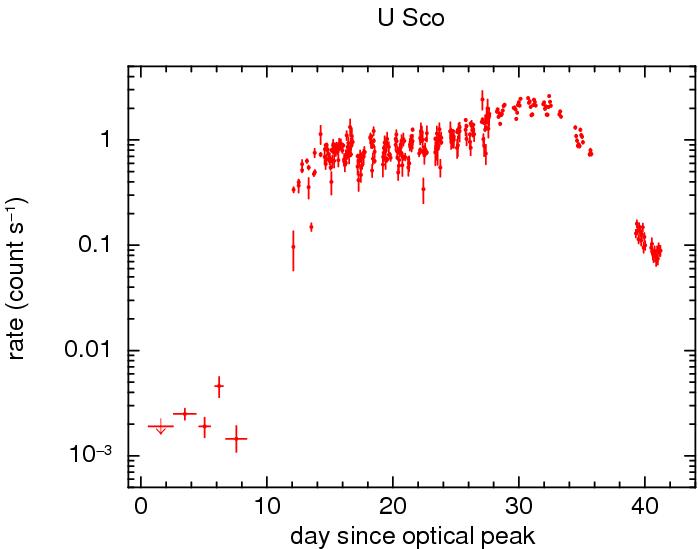
Figure 2: Swift XRT light curve of U Sco (0.3 - 10 keV count rate)
The full text of this ATel is available here.
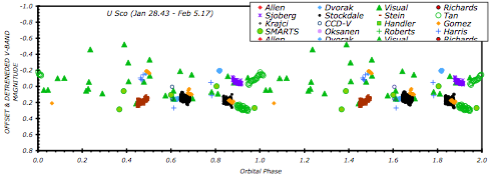
Figure 1: U Sco detrended and normalized V-band magnitudes for 2010 Jan 28.43 to Feb 5.17 (0.0 to 7.74 days after the discovery). The horizontal axis is orbital phase (for an ephemeris with an epoch of JD 2451234.539 and a period of 1.2305470 days) with the phase running from 0.0 to 2.0 (so each magnitude is plotted twice) to better show any eclipse.
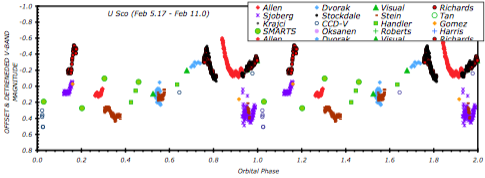
Figure 2: U Sco from 2010 Feb 5.17 to Feb 11.0 (7.74 to 13.57 days after the discovery).
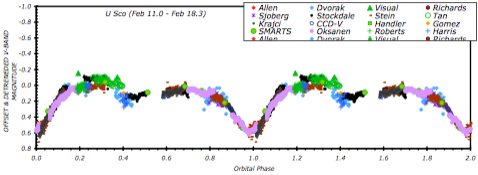
Figure 3: U Sco from 2010 Feb 11.0 to Feb 18.3 (13.57 to 21.37 days after the discovery).
The full text of this ATel is available here.