S3 Calibration Data Quality Flag
Gabriela Gonzalez, March 3, 2004
I created a list of minutes with bad or missing calibration in S3
segments for all three interferometer, in the text files L1CalDQ.txt, H1CalDQ.txt, H2CalDQ.txt.
The files have four columns:
- the science segment number, from the
S2 Segment Data Quality Repository web page;
- the GPS second that indicates the start of an interval of bad or
missing calibration;
- the duration of the bad interval, in seconds;
- and, when a value of alpha*beta is available, the alpha*beta
value.
We used the the V1 "official calibration", found in the links in the
S3
calibration web page. When no V1 calibration data is available for
any time in a science segment, the DQ file has a string "no data" next
to the science segment number.
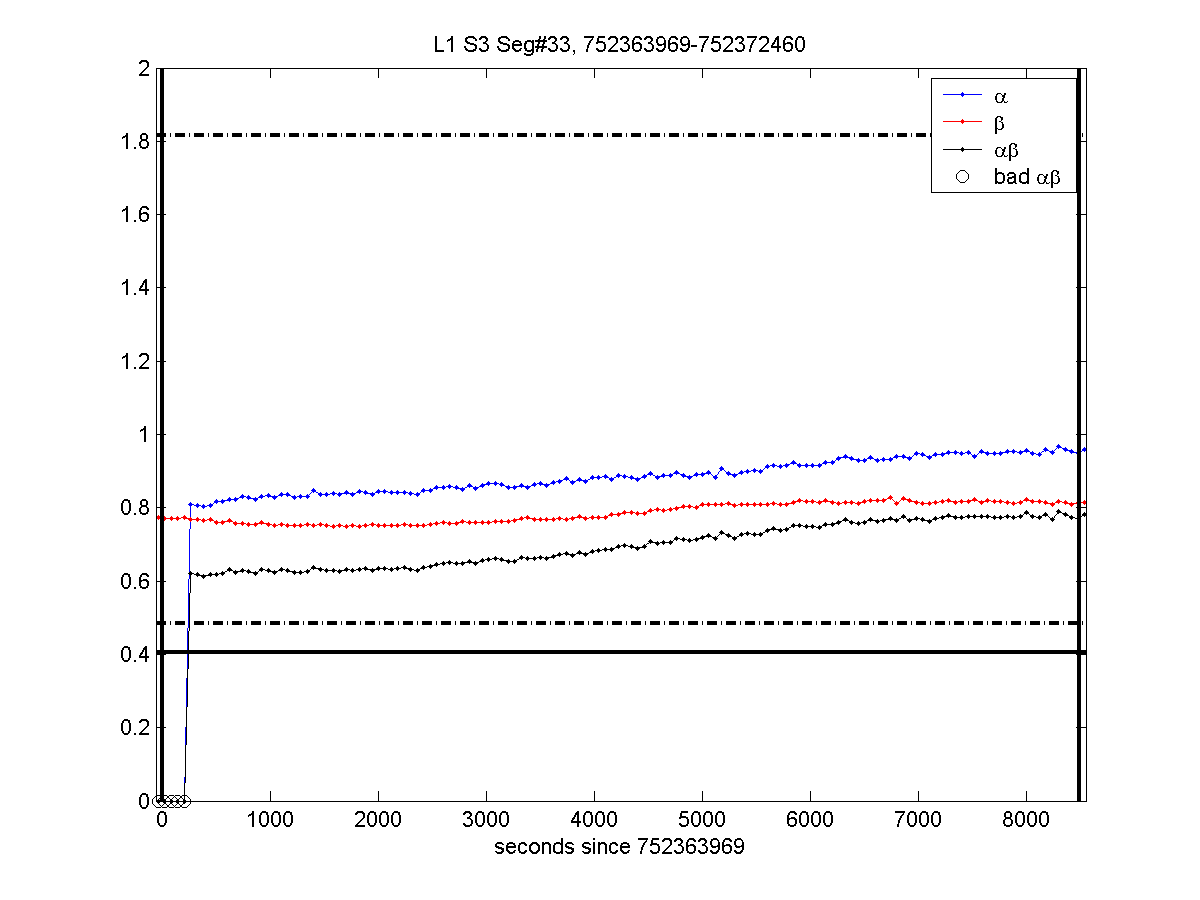
The values for alpha, beta, and alpha*beta;
and the "bad" calibration values in the text files listed above are
plotted, for each science segment, in the folders L1Plots, H1Plots and H2Plots. In these plots, the solid vertical lines
indicate the boundaries of the science segment; the solid horizontal
lines indicate the servo stability boundary for the values of the open
loop gain alpha*beta; the dashed lines indicate the boundaries used to
determine valid calibration values (20% away from the servo
stability).
We used the Matlab scripts L1CalibDQbit.m, H1CalibDQbit.m, H2CalibDQbit.m to make the calibration DQ files and plots. These files use as inputs the S3L1v00_segs.txt , S3H1v00_segs.txt , and S3H2v00_segs.txt list of segments prepared
by Keith Riles and Peter Shawhan in the S3 Segment
Data Quality Repository; and the list of alpha, beta
values in S3
Calibration V.1
Some notes on the results:
- The alpha values for all detectors are calculated from estimates
of the amplitude of the calibration line done by SenseMon, averaged
over 60 second intervals. The values of beta are calculated by
SenseMon from EPICS data. A script was later used by Patrick Sutton
for LHO and Gabriela Gonzalez for LLO, to calculate from this
information a list of alpha and beta values for times in S3. This is
the information posted as "V1 Calibration" in the calibration web
page.
However, the format of this "official V1 calibration" for
LLO and LHO was slightly different: - for L1, the file
"L1AlphaBeta.zip" in the L1 S3
calibration web page has a list of gps times, alphas and betas
for all times when SenseMon produced a value (even if identically
zero);
- For H1 and H2, the files "Hn_AlphaBeta.txt" in the web
pages for S3
H1 calibration and for S3
H2 calibration contain ONLY physical alpha,beta values for GPS times within
a science segment.
As a consequence of this, V1 calibration does not have information
about the existence of calibration at the beginning of a science
segment in LHO, and thus most of the LHO segments have a bad DQ flag
for a number of seconds at the beginning of each science segment. This
flag will likely be removed when we post V2 calibration, which will
have information on whether this information exist or not, and whether
it is valid.
- There are several instances when the interval between
consecutives GPS times written by Sensemon is not 60 seconds. This is
most likely due to "DMT dropouts", and not intrinsic problems with the
calibration lines. However, the DQ information assigns a bad flag to
those seconds that are not associated with the 60 seconds following a
time stamp created by Sensemon, since that is the information a code
will use with V1 calibration. We ware working on fixing this problem
for V2 calibration, and again these flags will likely go away.
- Some details on L1 calibration DQ:
- There are 569 minutes with bad calibration that overlap at
least partially with a science segment, or less than 2.5% of the total
time.
- There are 48 segments that do not have calibration
available for the whole segment:
- the first three science
segments in S3 (637, 611 and 5725 seconds respectively);
-
Segments #342 (start 755895570, duration 1274 sec), #343 (start
755901026, duration 1053sec), and #348 (start 755922013, duration 1363
sec), all on December 19, 2003 CST;
- 42 other segments
shorter than 762 seconds.
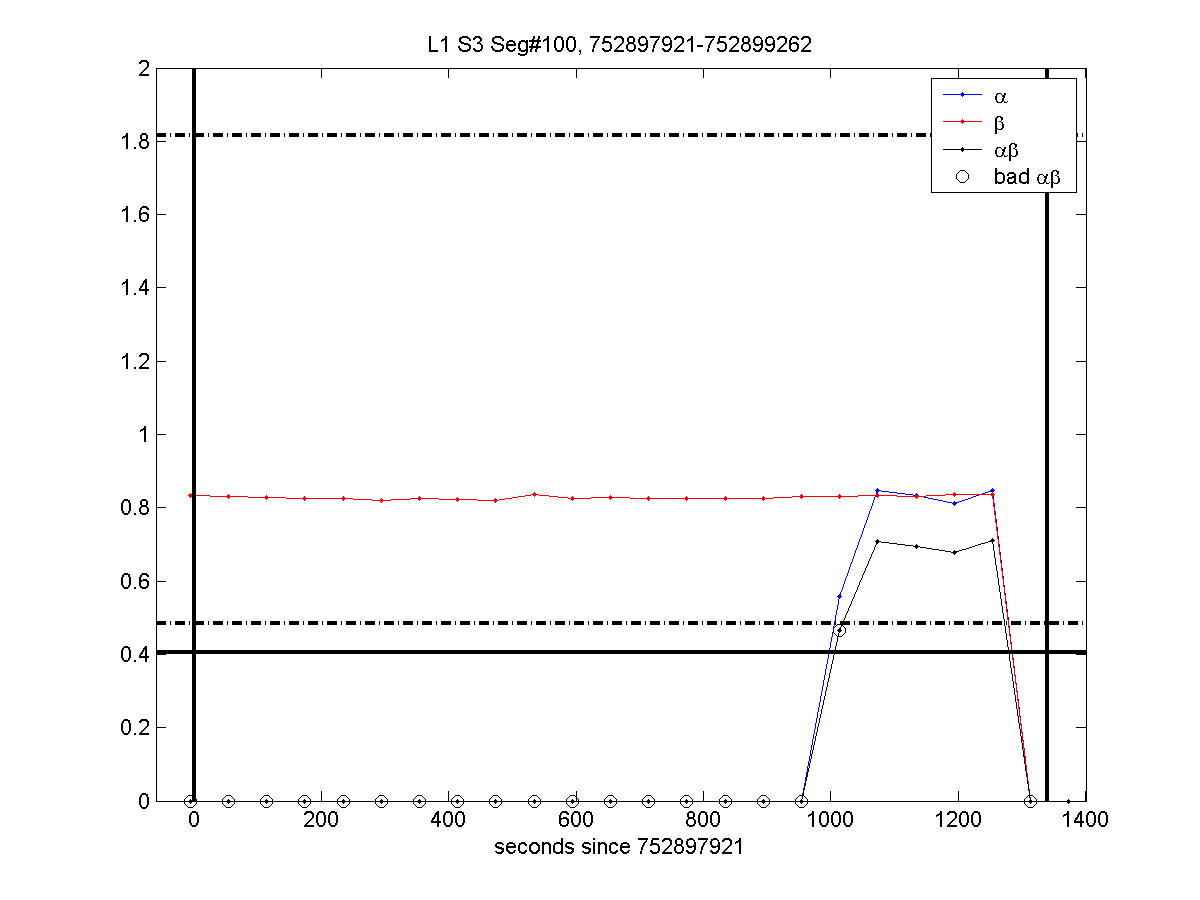
- There are only two
bad values of alpha*beta not identically equal to zero, in segs # 100
and 238. Although the threshold used was supposed to avoid times when
the servo was at the verge of unstability, these two times are "bad"
because the calibration line had been turned on the previous minute,
and its amplitude was still transitioning to a stable value.
- 383 segments have between one and 60 seconds with invalid
calibration at the end of the segment, due to lock loss. 128 segments
have bad calibration at the beginning, due to the calibration line not
being turned on more than a minute before the science segment started.
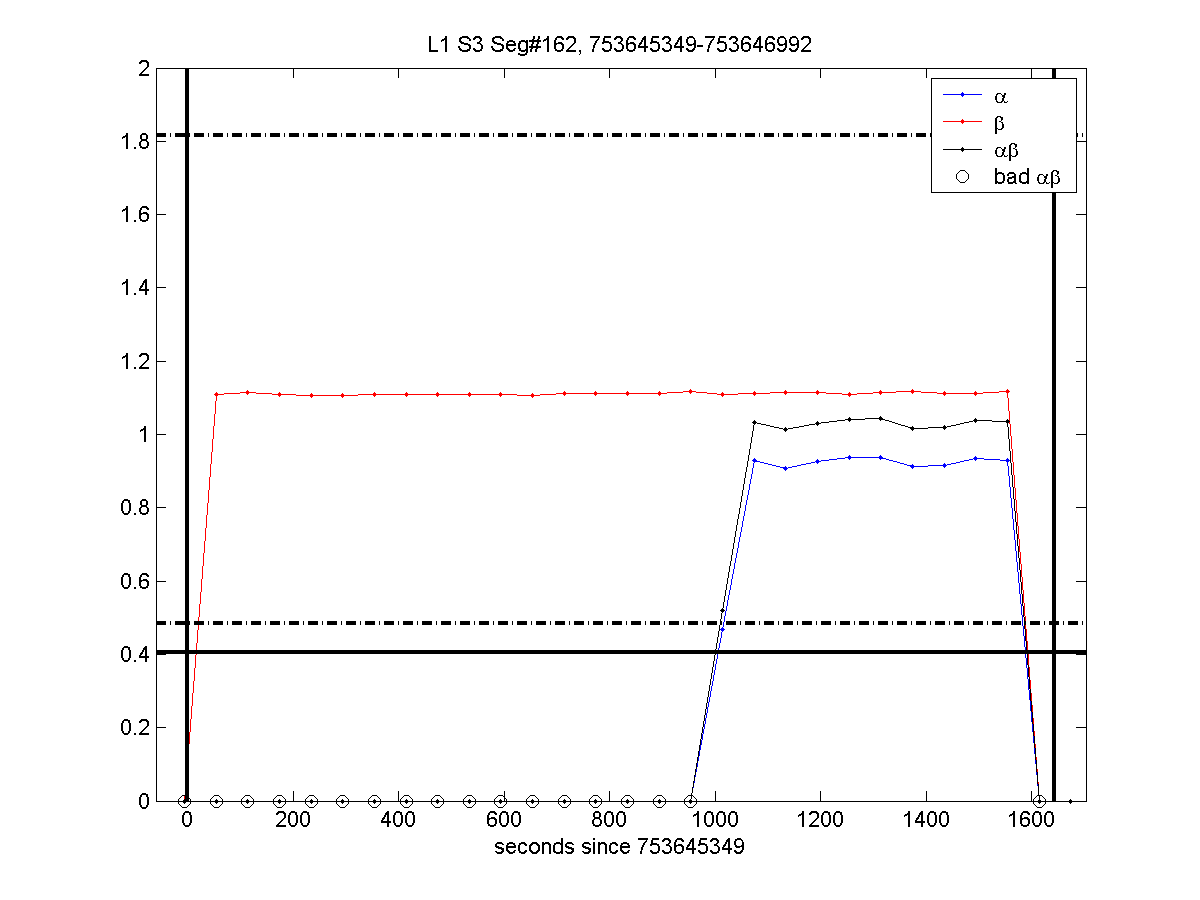
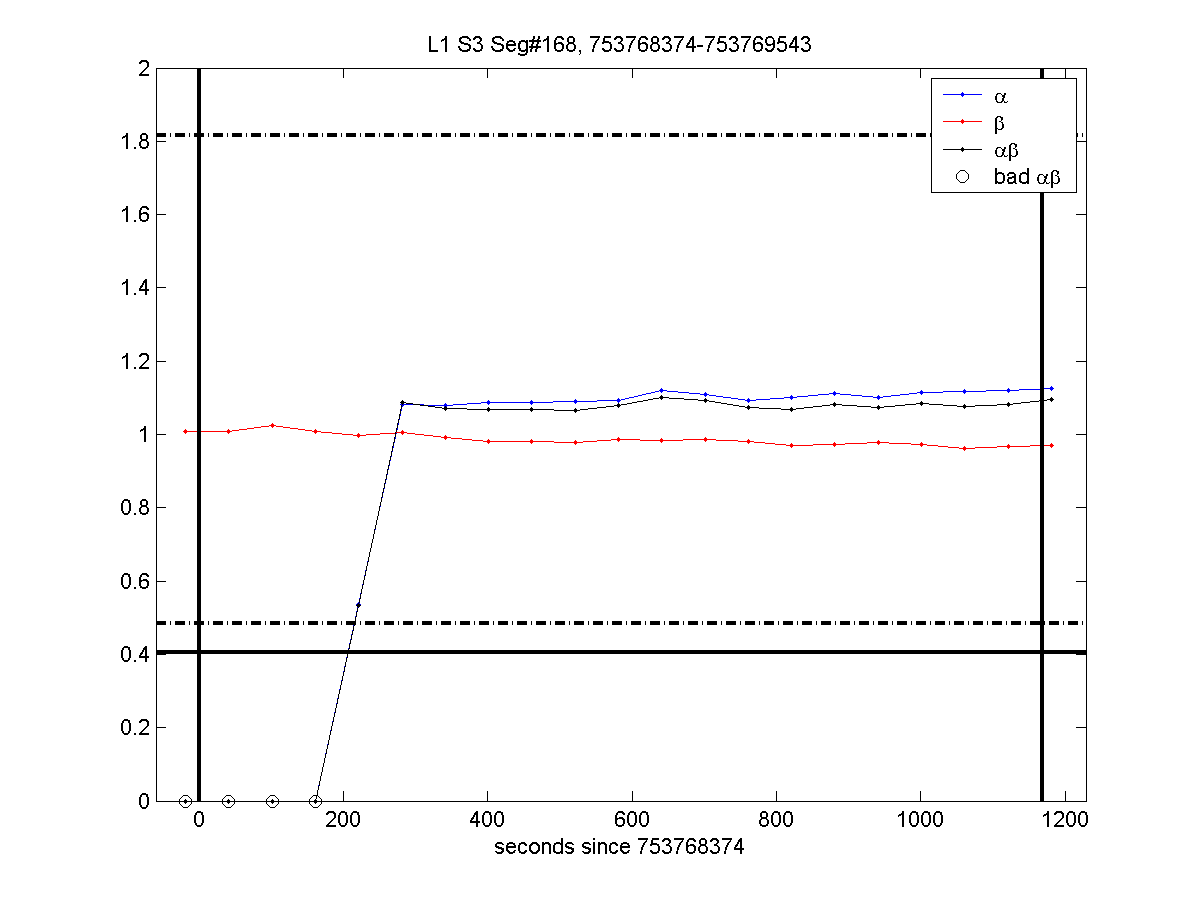
- Only 8 segments have bad calibration at other minutes than
just the first or the last one. Of these, five were due to the
calibration line being turned on late:
- #33 (several minutes at the
beginning without a calibration line);
- #100 (15 minutes without lines in
a 23 minute segment that ends with a lock loss);
- #162 (15 minutes without lines in
a 28 minute segment that ends with a lock loss);
- #168 (several minutes at the
beginning without a Calibration line);
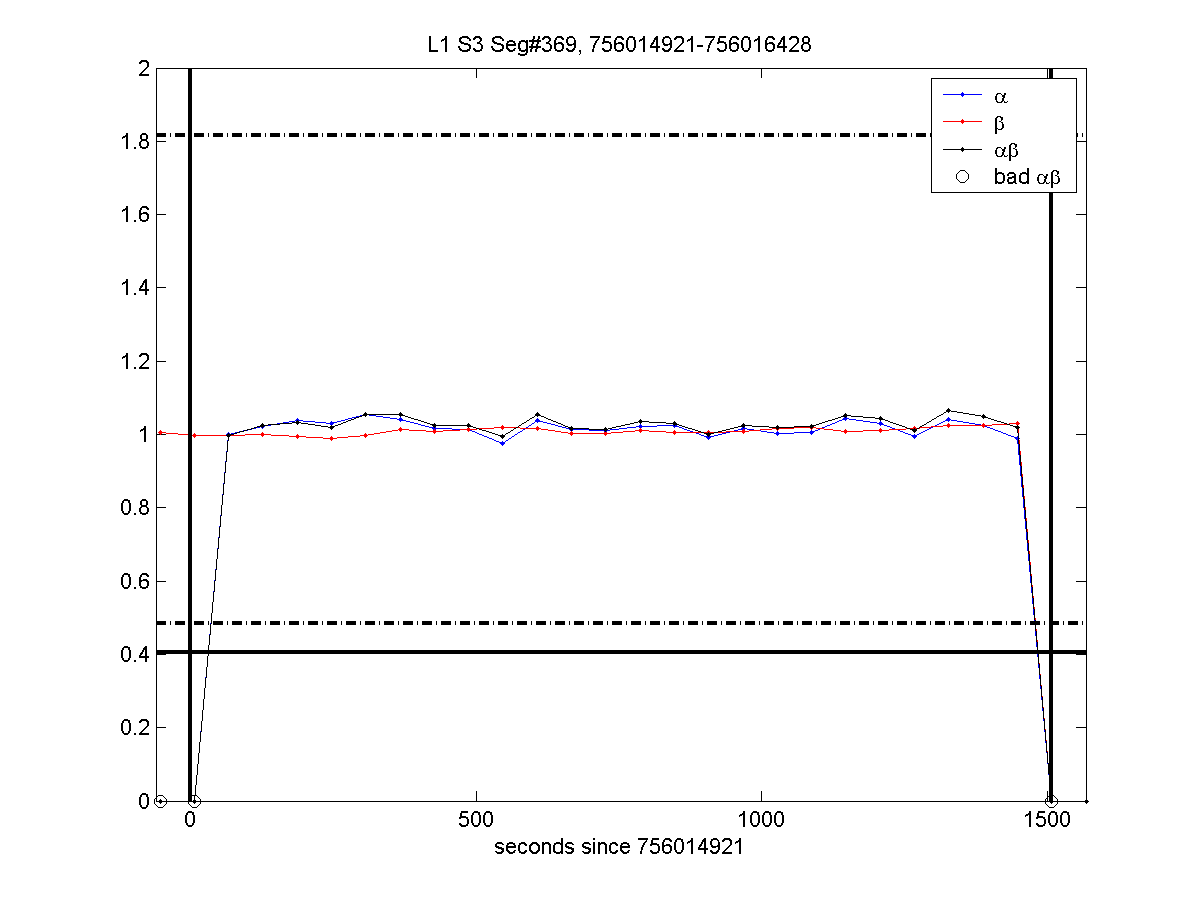
- #369 (60+ seconds at the
beginning without a calibration line).
and three segments
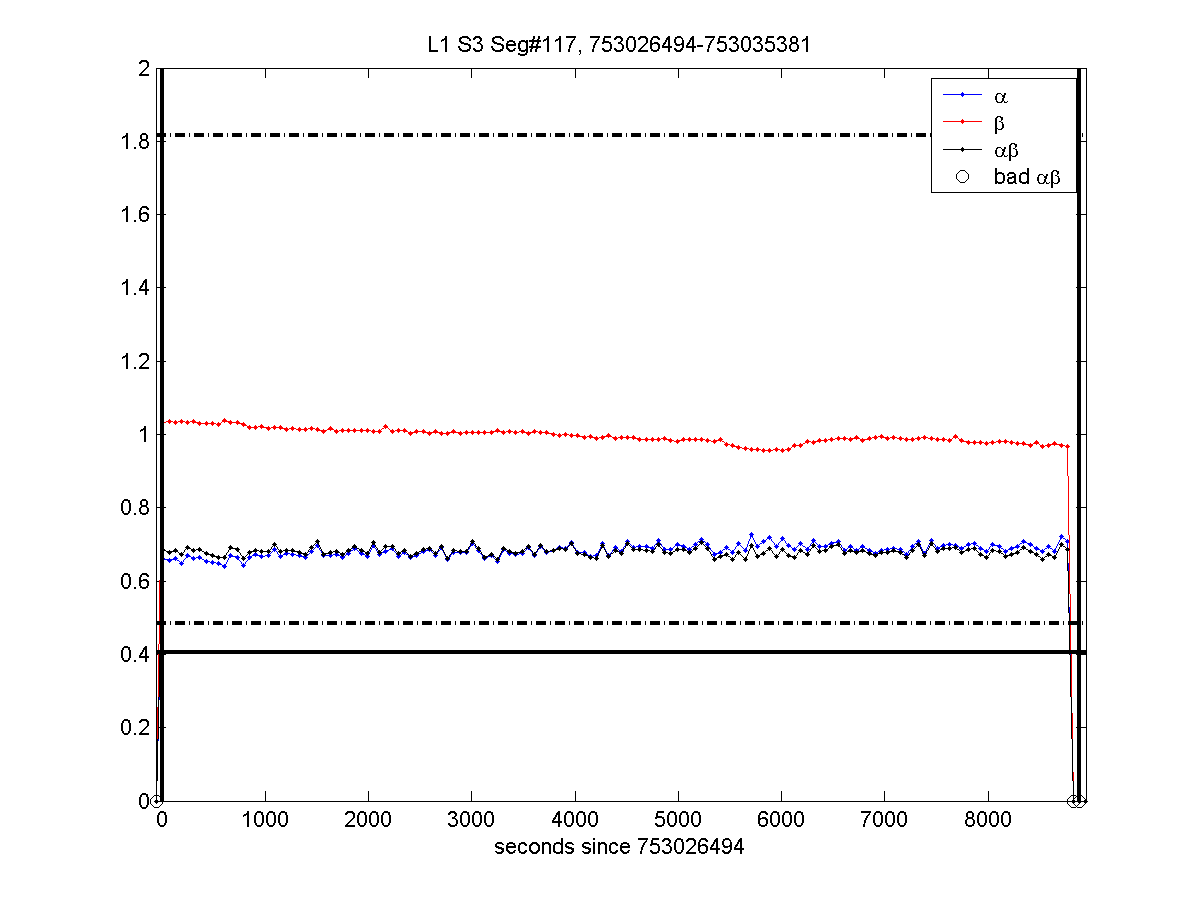
had other pathologies that may be worth worrying about: - #117 (two minutes at the end
without alpha or beta, maybe lock lost before end of science
segment?);
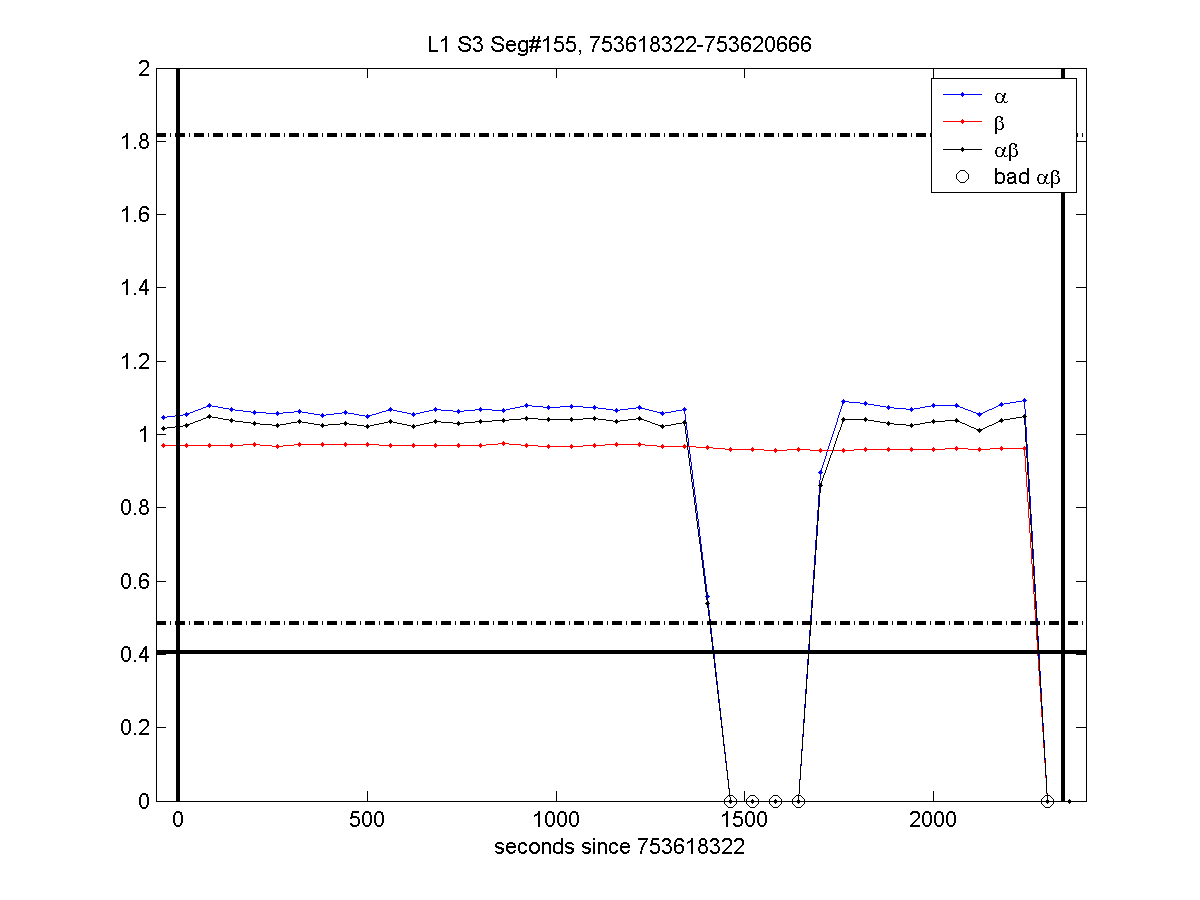
- #155
(four minutes without line in the middle of the segment; the following
value is above threshold but probably bad calibration?);
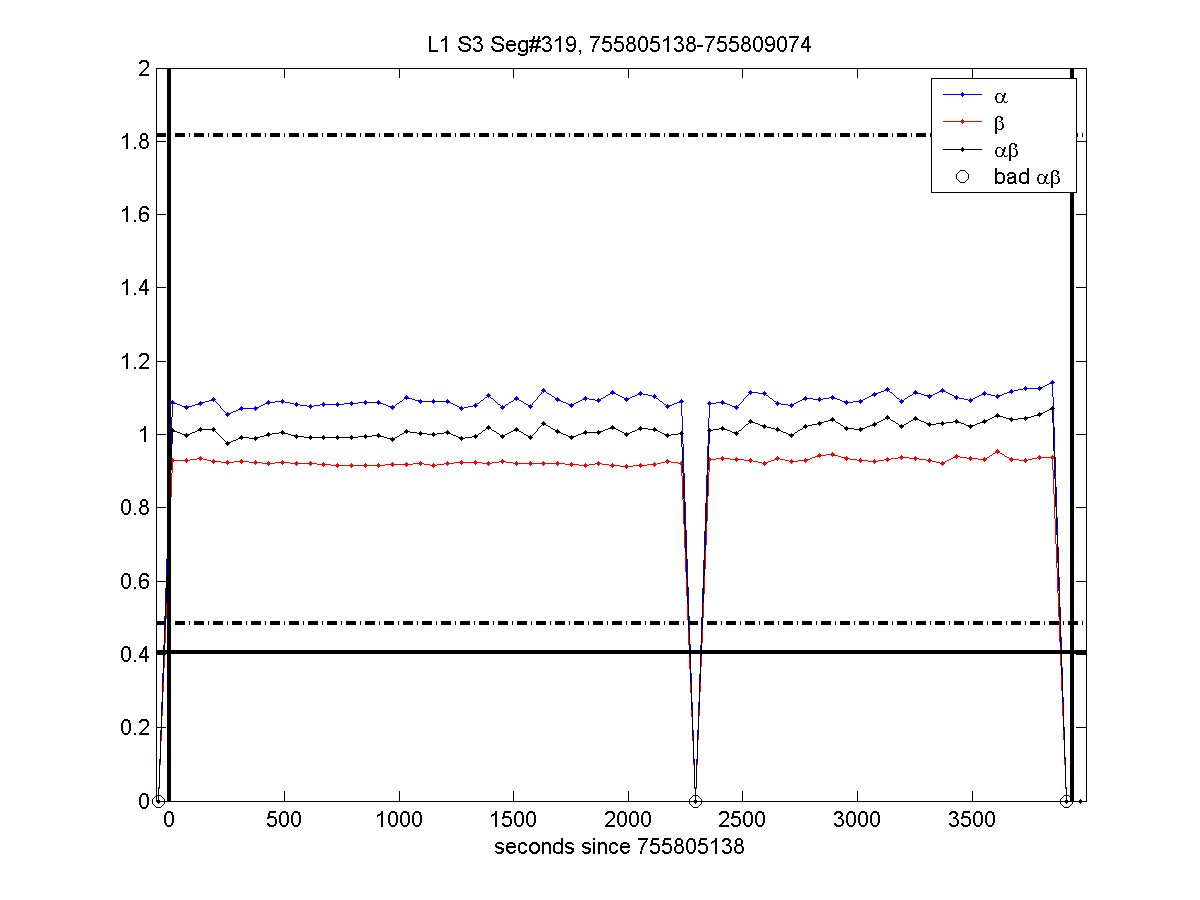
- #319 (a single minute with zero
alpha, beta in the middle of a segment 66 minutes long, maybe a data
acquisition or datawriting failure?)
Gabriela Gonzalez